How to Create a Sales Process Flow Diagram: A Step-by-Step Guide
Learn how to create an effective sales process flow diagram to streamline your sales cycle, boost team efficiency, and drive better conversions.

Understanding a Sales Process Flowchart
1. Definition of a sales process flowchart as a visual representation
2. Purpose and strategic benefits in optimizing sales procedures
3. Benefits for new hires and ongoing sales operations
Key Elements of a Sales Process Flowchart
1. Stages of the sales process: prospecting, lead qualification, presentation, handling objections, closing, follow-up
2. Symbolic elements: arrows for flow direction, decision points, process blocks
Steps to Create a Sales Process Flowchart
1. Gather information from relevant team members
2. Collate and standardize the process for consistent understanding
3. Personalize the flowchart with specific stages relevant to your sales process
Mapping the Sales Process
1. Define each stage clearly, from lead generation to closure
2. Identify key decision points and customization options
3. Document each step and role involved
Using Sales Process Flowchart Templates
1. Consider existing templates as a starting point
2. Customize templates based on specific sales needs and objectives
Evaluation and Adjustment
1. Evaluate results and document observations
2. Iterate continuously based on feedback and market changes
3. Make necessary adjustments to better align with actual sales process
Common Mistakes to Avoid
1. Avoid overcomplicating the process
2. Ensure the flowchart is frequently updated and aligns with current practices
3. Incorporate feedback from the entire sales team to enhance accuracy
Conclusion
1. Streamlining the sales process enhances productivity and efficiency
2. Flowcharts provide clarity and improve the understanding of the customer journey
Revised Outline
Introduction
- Overview of the importance of having a structured sales process for better efficiency, consistency, and performance.
- Introduction to sales process flowcharts as a tool to visualize and streamline the sales process.
What is a Sales Process Flowchart?
- Define a sales process flow diagram and its role in guiding sales teams through each stage.
What’s the Difference Between a Sales Process Flowchart and a Sales Pipeline?
Key Elements of a Sales Process Flowchart
- Stages of the Sales Process: Breakdown of the typical stages such as:
- Lead Generation
- Lead Qualification
- Proposal and Negotiation
- Closing
- Post-sale Follow-up
- Symbolic Elements:
- Arrows to indicate flow direction and sequence of actions.
- Decision points to highlight choices or actions needed (e.g., qualified vs. unqualified lead).
- Process blocks for each task or milestone in the process.
Sales Process Flowchart Examples to Guide Your Team
Creating a Sales Process Flowchart: A Step-by-Step Guide
Benefits of Creating a Sales Process Flowchart
- Improved Efficiency: Streamlining workflows and reducing redundancies.
- Consistency Across Teams: Ensuring every team member follows the same structured process.
- Clear Performance Tracking: Measuring and analysing sales performance at each stage is easier.
- Better Communication: Improves transparency and understanding among team members and stakeholders.
- Onboarding New Hires: Providing a clear visual representation that helps new hires understand the process quickly.
Common Mistakes to Avoid
- Overcomplicating the Process: Keep the flowchart simple and easy to follow. Avoid adding unnecessary steps.
- Failing to Segment the Audience: Ensure you are segmenting your leads properly, targeting the right people with the right messaging.
- Neglecting Automation: Don't ignore automation tools like Floworks, which can help streamline your process, especially for follow-ups.
- Not Involving the Entire Team: Regular feedback from the sales team ensures accuracy and relevance, so gather insights and feedback.
Conclusion
Optimizing your sales process is crucial for driving growth and improving efficiency. But how do you ensure your sales team stays on track, meets goals, and increases conversions? One powerful tool that can help is a sales process flowchart. A well-structured flowchart allows teams to visualize each stage of the sales journey, identify bottlenecks, and enhance overall performance.
Did you know businesses with defined sales processes are 33% more likely to hit their revenue goals?
But what exactly does a sales process flowchart look like? How can you create one that will guide your sales team to success? Let's explore the steps and best practices to build a sales process flowchart that streamlines your efforts and drives measurable results.
What is a Sales Process Flowchart?
A sales process flowchart or diagram is a visual representation of the steps involved in your sales cycle, from the initial contact with a potential customer to the final sale. It maps out each stage of the process, helping your team understand where they are in the journey and what actions must be taken next.
A flowchart lays out the sales process step by step, helping clarify roles, responsibilities, and expectations and ensuring everyone involved knows what to do at every point in the process. Whether identifying leads, qualifying prospects, or closing deals, a flowchart creates a clear path that guides salespeople through their tasks efficiently.
Now, let's break down the essential components of a strong sales process flowchart.
Key Elements of a Sales Process Flowchart
When creating a sales process flowchart, it’s essential to include key elements that will map out the stages and provide clarity and structure for your team. Here are the crucial components that every sales process flowchart should include:
Key stages
- Lead Generation: This is where the sales journey begins. Lead generation involves identifying potential customers through inbound methods like content marketing and social media or outbound strategies such as cold calling and email outreach.Alisha can help you automate lead capture and ensure no potential prospect is overlooked.
- Lead Qualification: Once a lead is generated, it’s important to determine whether they’re a good fit for your product or service. This stage filters out unqualified leads and ensures that sales efforts focus on prospects who are more likely to convert.
- Needs Assessment: During this stage, the salesperson engages with the lead to understand their needs, challenges, and goals. This helps tailor the sales pitch and present the right solution.
- Proposal and Negotiation: This stage often involves sending a proposal or quote, negotiating terms, and addressing any concerns or objections from the prospect. A sales process flowchart should outline how proposals are presented, tracked, and followed up.
- Closing the Deal: Closing is when the prospect finally decides to purchase. This involves signing contracts, processing payments, and finalizing the sale. The flowchart should clearly define the steps needed to close the deal officially and mark the transition from prospect to customer.
- Post-Sale Follow-Up: A successful sale doesn't end once the contract is signed. Post-sale follow-up ensures customer satisfaction, encourages repeat business, and opens the door for referrals.
Ready to create your own? Here’s a simple, step-by-step guide to help you get started.
Creating a Sales Process Flowchart: A Step-by-Step Guide
Creating a sales process flowchart may seem daunting, but with a systematic approach, you can easily break it down and create a tool to guide your team to success. Here's a step-by-step guide to help you design a sales process flowchart that works:
Step 1: Gather Data
Before creating a flowchart, you need to understand the existing sales process. Here's how:
- Talk to Stakeholders: Gather insights from team members who interact with customers daily, such as sales reps, managers, and customer service teams.
- Get Input from Other Teams: Include feedback from departments like marketing, product teams, and finance to identify any disconnects between departments.
- Identify Current Practices: Gather data on your team's practices, methodologies, and challenges in the sales process.
This helps you pinpoint gaps and establish a clear foundation for a unified sales process.
Step 2: Collate & Standardize Your Process
Now that you've gathered the data, it's time to standardize your sales process:
- Document Each Stage: Based on your data, document each step of the sales process, such as prospecting, qualification, needs assessment, proposal, and closing.
- Optimize the Customer Journey: Streamline the process by eliminating inefficiencies. Combine your team's best practices and isolate errors or unnecessary steps.
- Focus on Clarity: Ensure that each stage is easy to follow and that everyone knows their responsibilities. Avoid information overload by making the flow simple but informative.
Pro tip: Include customer-oriented goals, best practices, and relevant data points in your documentation to give sales reps a complete view of the process.
Step 3: Map Out the Sales Flow
With a standardized process, it’s time to start laying out the flowchart:
- Arrange Stages in Order: Start with the first step, lead generation, and map each stage sequentially, ensuring a logical progression.
- Include Decision Points: Use diamond shapes to represent decision points (e.g., “Is this lead qualified?”) and include arrows to show the flow from one stage to the next.
- Use Clear Symbols: Stick to standard flowchart symbols (rectangles for actions, diamonds for decisions, ovals for starting/ending points).
This step helps visually clarify how the process moves from one action to the next.
Step 4: Incorporate Roles and Responsibilities
To avoid confusion and ensure accountability, assign roles to each stage:
- Define Ownership: Specify who is responsible for each stage—sales rep, manager, or support team. This ensures clarity and prevents duplication of efforts.
- Annotate the Flowchart: Include role annotations either within the flowchart or in a separate legend for reference.
This ensures every team member knows exactly what’s expected of them during each step of the sales process.
Step 5: Choose the Right Flowchart Tool
Select a tool that will allow you to design, update, and share your sales process flowchart easily:
- Tool Options: Choose from tools like Lucidchart, Microsoft Visio, Google Drawings, or any other that fits your team’s needs.
- Flexibility: Ensure the tool provides easy collaboration and can be updated quickly as your sales process evolves.
Using the right tool makes the design and future updates much easier.
Step 6: Integrate Automation Tools and Technology
To streamline your sales process even further, consider integrating automation tools:
- Automate Routine Tasks: Use tools like CRM systems and sales automation platforms to handle repetitive tasks such as data entry, follow-up reminders, and lead tracking.
- Add Automated Decision Points: Mark where automation can handle certain actions in your flowchart (e.g., automated email follow-ups after a proposal).
This reduces manual work and allows your sales team to focus on higher-value tasks.
Step 7: Review and Test the Flowchart
After creating your flowchart, put it to the test:
- Gather Feedback: Share the flowchart with your customer-facing teams (sales reps, managers, etc.) and get their input on how well it aligns with their day-to-day tasks.
- Monitor Adherence: Track how well the team follows the process and whether it needs adjustments based on real-world challenges.
- Set KPIs: Define key performance indicators (KPIs) such as response times, conversion rates, and customer satisfaction to measure success.
This phase helps ensure that the flowchart works as intended and highlights any areas for improvement.
Step 8: Iterate and Improve
A sales process flowchart should never be static. Continuously improve it:
- Revisit Regularly: Set quarterly or biannual reviews to evaluate whether the process still aligns with your team’s needs and the market.
- Get Team Input: Ensure you involve your sales team in every review session. They’ll have the best insights on what’s working and what isn’t.
- Tweak for Improvement: Minor adjustments, based on feedback and performance data, can make a big difference in the overall process.
Iteration ensures that your sales process flowchart remains effective and up-to-date.
Step 9: Personalize and Distribute
Once the flowchart is finalized, make it accessible to your team:
- Add Branding: Use your company’s brand colors, logo, or even a motivating tagline to make the flowchart feel more personal and engaging.
- Distribute Electronically: Distribute the flowchart as a digital file, allowing easy access and updates. Ensure your team can quickly reference it during calls, meetings, or training.
- Link to Additional Resources: Include helpful links to call scripts, buyer personas, objection-handling tips, product leaflets, or any other resources that can aid your team in real-time.
Step 10: Monitor and Update Regularly
Sales processes and environments are always evolving, so it’s important to monitor and update the flowchart:
- Set Update Dates: Establish regular intervals (quarterly, bi-annually) for reviewing and updating the flowchart.
- Stay Adaptable: The flowchart should be adjusted as customer behavior shifts, new tools are integrated, or processes change.
Regular updates keep your sales process relevant and aligned with current business practices.
By following this comprehensive, step-by-step guide, you'll create a sales process flowchart that maps your sales cycle and serves as a powerful tool for efficiency, accountability, and continuous improvement.
Let's look at two common flowchart examples used by sales teams to help you visualize how this works in real scenarios.
Sales Process Flowchart Template Examples
Before you design your sales process flowchart, it helps to see what effective ones look like. Whether managing a lean startup sales team or leading a large enterprise operation, visualizing your process can spotlight gaps, optimize handoffs, and keep your reps moving in sync.
Here are a few sample sales flowcharts to inspire your design, ranging from simple to sophisticated.
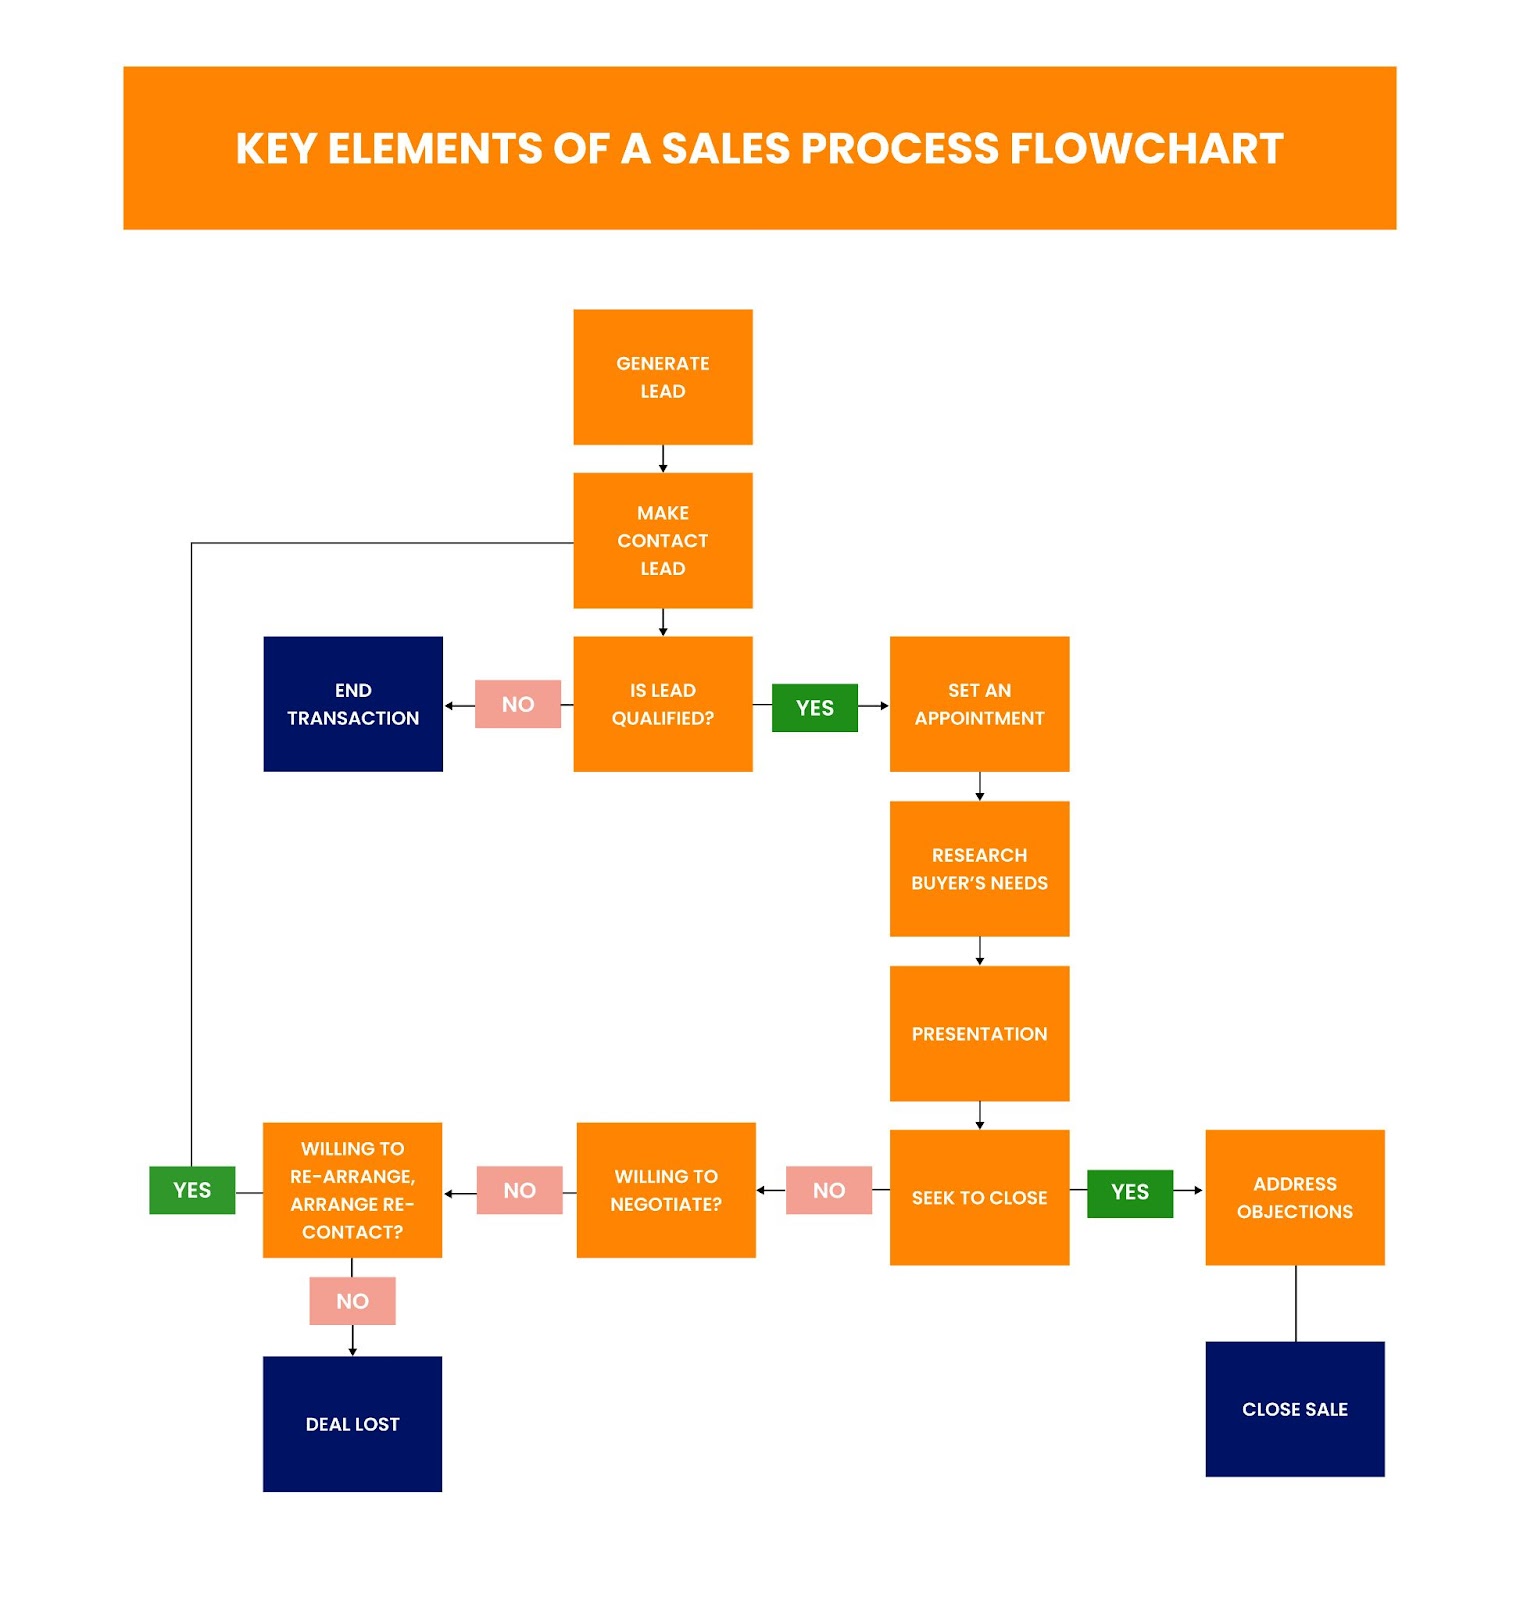
Example 1: The Simple Sales Process Flowchart
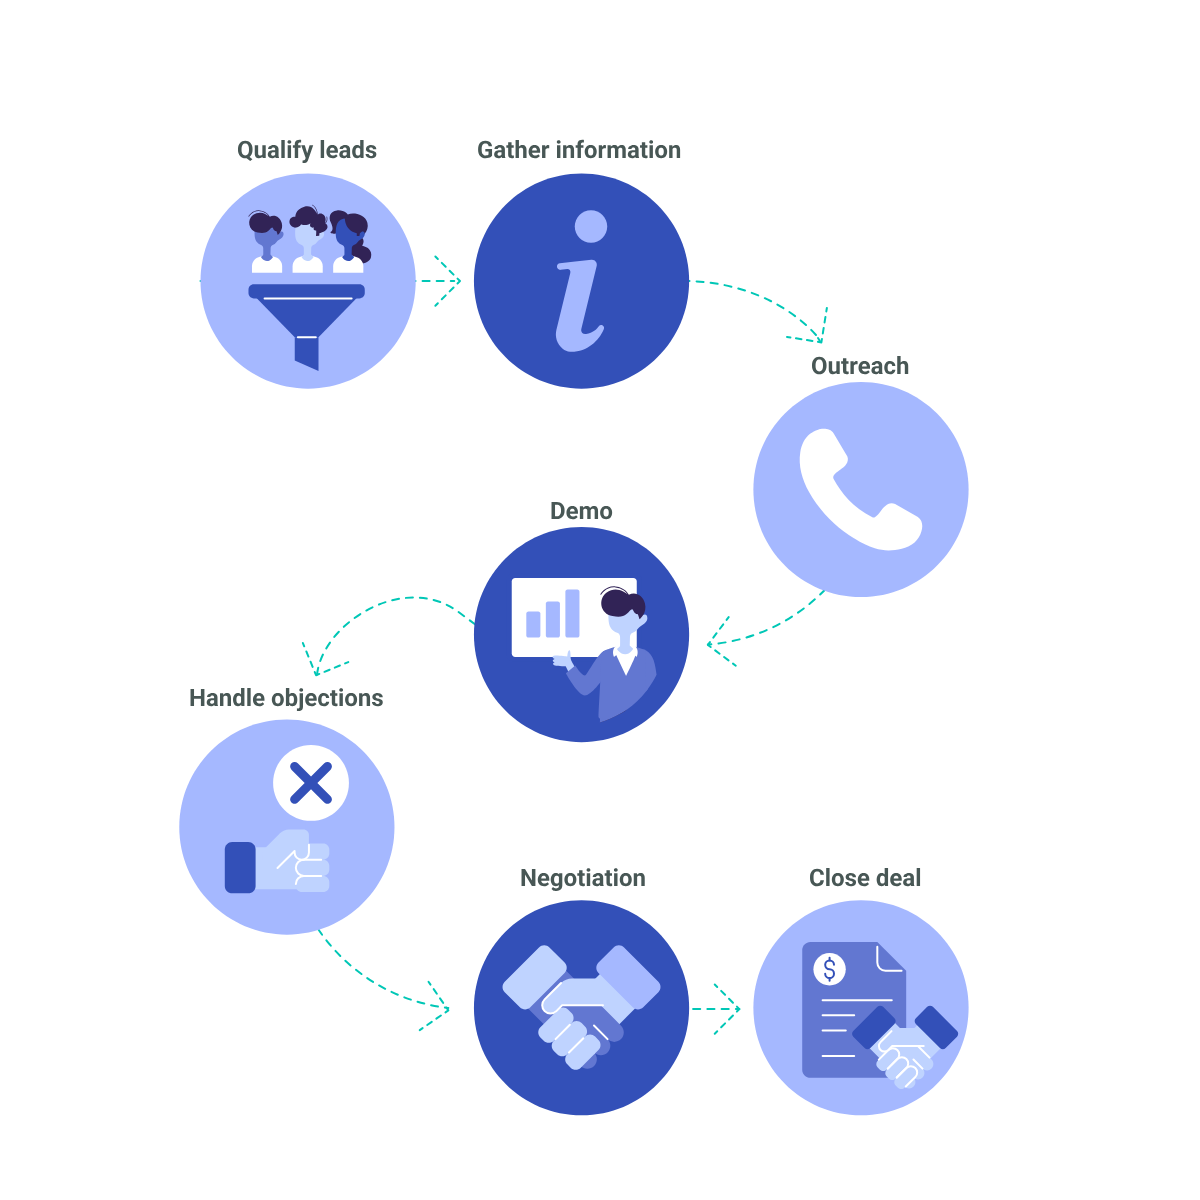
This streamlined flow is ideal for smaller teams or early-stage businesses looking for a structure without complexity. It typically includes seven core stages:
- Lead Qualification: Assess and filter leads that don’t meet your ideal customer profile (ICP). This ensures you're focusing efforts on leads most likely to convert.
- Preparation: Research the lead’s background, needs, and challenges. Tailor your messaging and materials to make a relevant and impactful first impression.
- Initial Approach: Reach out through email, phone, or a meeting invite. This is your first chance to capture their attention and start building rapport.
- Presentation: Showcase your product or service in a way that speaks directly to the lead's pain points and goals. Highlight the specific benefits and value your solution provides.
- Objection Handling: Address any concerns or questions the lead has with clarity and confidence. Providing well-thought-out responses can build trust and keep the conversation moving forward.
- Closing: Finalise the deal by negotiating terms, addressing any last-minute concerns, and securing the commitment to move forward.
This type of flowchart offers a clear and repeatable path that helps new reps ramp up faster and ensures consistency across the team.
Example 2: The Detailed Sales Process Flowchart
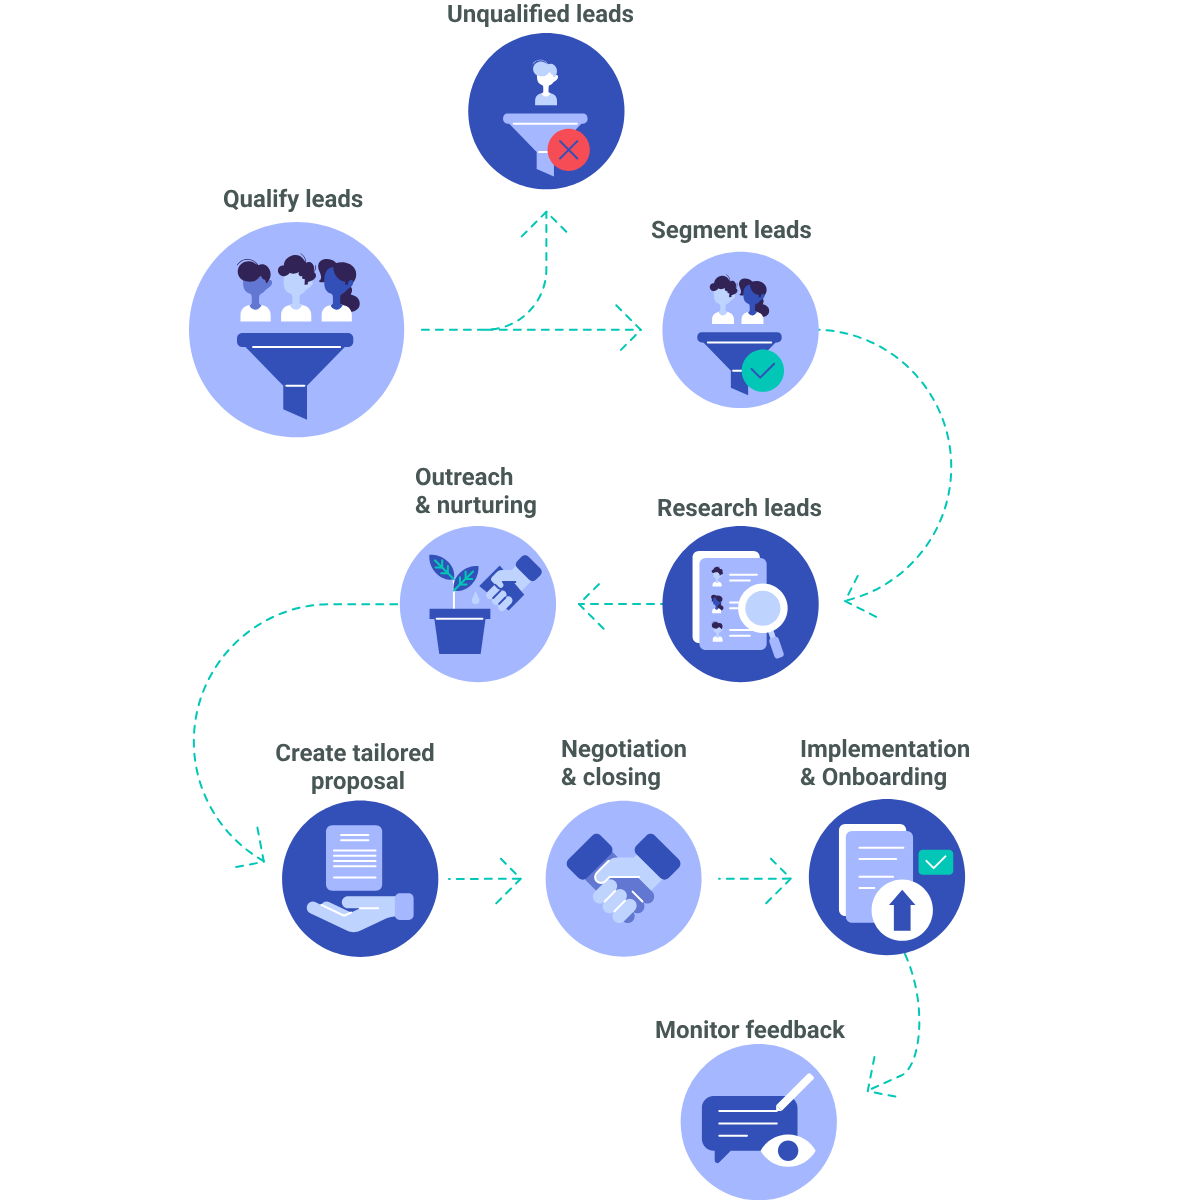
More mature sales organizations—especially in B2B or mid-market/enterprise environments—often require a more granular approach. These flowcharts expand the core process to include key strategic stages like segmentation, nurturing, and post-sale engagement.
Here’s what a detailed version might include.
- Lead Qualification: Assess the lead’s alignment with your ideal customer profile to ensure they meet the necessary criteria for engagement.
- Lead Segmentation: Categorise leads based on variables such as industry, company size, or purchasing behaviour to target them more effectively.
- Discovery & Research: Conduct in-depth research to uncover the lead’s pain points, budget constraints, key stakeholders, and purchasing intent.
- Lead Nurturing: Engage leads through tailored drip campaigns, educational content, or periodic follow-ups to maintain interest.
- Proposal Development: Craft a customized proposal and pricing strategy that directly addresses the lead's unique needs and business challenges.
- Negotiation & Closing: Finalise deal terms by addressing any objections and clarifying contractual details to secure the sale.
- Post-Sale Enablement: Initiate the customer onboarding process, ensuring smooth implementation and providing necessary training to facilitate success.
- Follow-Up: Conduct regular follow-ups to gather feedback, assess customer satisfaction, and identify opportunities for upselling or cross-selling.
The benefit of this kind of chart is that it ensures no opportunity slips through the cracks and gives your team a strategic framework for managing longer, more complex sales cycles.
Pro tip: Under each major stage, list out specific tasks or deliverables. For example, in post-sale enablement, you might include: sending a welcome kit, scheduling training sessions, or launching a customer satisfaction survey.
Taking It Further: From Sales Flowcharts to Sales Automation
Creating a sales process flowchart is a solid first move. It sets the foundation for structure, alignment, and repeatability. But today’s sales landscape moves fast, and static charts can only take you so far.
To truly scale, you need more than a process—you need automation that adapts in real-time.
That’s where Floworks comes in.
With Alisha, your AI Sales Development Representative, you can go beyond flowcharts and bring your sales strategy to life. Alisha handles your cold outreach, lead qualification, follow-ups, and meeting scheduling—freeing your reps to focus on building relationships and closing deals.
✅ Spot high-intent leads faster ✅ Never miss a follow-up ✅ Scale outreach without scaling headcount ✅ Integrate seamlessly with your CRM
Ready to turn your sales process flowchart into real results?Let Alisha do the heavy lifting—Get started with Floworks and meet your new AI SDR today.
Beyond organization, building a sales flowchart comes with several practical benefits—let’s explore those next.
Benefits of Creating a Sales Process Flowchart
Creating a sales process flowchart is about applying numerous benefits that can improve your sales team's performance and streamline your entire sales operation. Here are some of the key advantages of implementing a sales process flowchart:
- Improved Clarity and Structure: It provides a clear view of the entire sales journey, making it easier for your team to understand their tasks at every stage. This reduces confusion and ensures that everyone knows exactly what to do and when.
- Increased Efficiency: Streamlines workflows by identifying bottlenecks and eliminating unnecessary steps. By focusing on essential activities, your team can work smarter, not harder, to close deals faster.
- Better Lead Management: Ensures consistent handling of leads at every stage, improving lead conversion rates. Visualising the process helps your team identify which leads need immediate attention, preventing any from slipping through the cracks.
- Enhanced Training: Serves as a valuable tool for onboarding new salespeople, reducing their learning curve. With a visual guide to the sales process, new hires can quickly get up to speed and align with best practices.
- Consistent Sales Performance: Establishes a standardised process, leading to predictable results and better overall sales outcomes. When everyone follows the same process, it ensures uniformity and drives consistent success across your team.
In short, a sales process flowchart isn’t just a tool for organization—it’s a powerful strategy for enhancing sales performance, driving efficiency, and ensuring consistent results across your team.
As useful as they are, flowcharts can fall flat if not done right. Here are some common pitfalls to steer clear of.
Common Mistakes to Avoid
While creating a sales process flowchart can significantly improve your team’s efficiency and organization, some common mistakes can undermine its effectiveness. Here are the key pitfalls to avoid when designing your sales process flowchart:
Creating a sales process flowchart can enhance your sales operations, but common mistakes can hinder its effectiveness:
- Overcomplicating the Process: Keep the flowchart simple and focused on the key stages, avoiding unnecessary details. A cluttered chart can overwhelm your team and lead to confusion.
- Skipping Decision Points: Mark decision points clearly to ensure consistent, informed decision-making. These points help guide your team on the next steps, reducing errors and miscommunication.
- Not Assigning Roles: Define clear responsibilities for each stage to avoid confusion and task duplication. Without clear ownership, tasks may be overlooked or handled inefficiently.
- Neglecting Automation: Integrate automation tools to streamline processes and reduce manual work. Automation saves time and reduces the chances of human error, enhancing efficiency.
- Ignoring Regular Reviews: Continuously update and refine your flowchart to keep it relevant and effective. Regular reviews ensure that your flowchart aligns with changing business needs and market conditions.
By avoiding these common mistakes, you’ll create a sales process flowchart that truly benefits your team, providing a clear, actionable guide to success.
Conclusion
Creating a sales process flowchart is a powerful way to streamline your sales efforts, improve efficiency, and ensure consistency across your team. By defining clear stages, actions, and decision points and integrating automation where possible, you create a visual guide that can enhance your sales team's training and performance. Avoiding common mistakes, such as overcomplicating the flowchart or neglecting regular updates, ensures that your flowchart remains a valuable tool that adapts as your business grows.
If you're looking to optimize your sales process further, Floworks can help. With our advanced automation tool, Alisha AI SDR can do real-time data tracking and lead generation, automate the follow-up process, and provide seamless CRM integrations, enabling your sales teams to focus on closing deals instead of managing manual tasks.
Ready to take your sales strategy to the next level? Book a demo today to learn how we can help you design and implement a sales automation that drives growth, efficiency, and success.

FAQs
1. What makes a good process flow diagram?
A well-structured sales process flow diagram provides a visual representation of different stages in the sales process steps, ensuring clarity and consistency. It should be simple, standardized, and easy to interpret for sales team members, marketing teams, and decision-makers. A good sales process flowchart template includes key stages such as lead generation, prospecting, demo, contract signing, and after-sales service, minimizing common mistakes and optimizing sales performance.
2. What is a standard sales process flowchart?
A sales process flowchart visually maps out the typical sales process, guiding sales reps through different stages, from generating leads to converting them into a paying customer. A well-defined sales process map typically includes the following:
- Lead generation & prospecting – Identifying prospective customers and assessing qualified leads.
- Lead qualification – Filtering high-potential customers based on pain points and readiness to buy.
- Demo stage & negotiation – Presenting solutions via phone calls or meetings and addressing objections.
- Contract signing & closing – Finalizing agreements and ensuring smooth transitions.
- After-sales service & customer retention – Ensuring customers receive prompt support, fostering loyal customers.
A fixed flowchart helps sales staff and other teams understand the current process, improving efficiency and resource allocation while achieving sales goals.
3. What are 4 usual uses of a process flow chart?
A process flowchart is commonly used to visualize workflows, identify bottlenecks, and improve efficiency in business operations. It's also used for training to help new employees quickly understand standard procedures. Additionally, it can aid in process documentation and help identify areas for automation or improvement.
4. What are the three most important parts of the sales process?
The three most important parts of the sales process are lead generation, where prospects are identified; lead qualification, where the likelihood of conversion is assessed; and closing the deal, where a final agreement is made with the customer. These stages ensure that prospects are nurtured effectively and that sales are converted efficiently. Each stage plays a crucial role in driving revenue and maintaining customer relationships.
5. What’s the difference between a sales process flowchart and a sales pipeline?
While both terms are crucial for managing a sales process, they serve distinct roles:
- Sales Process is your strategic playbook, a repeatable set of actions that sales reps follow to guide a lead from first contact to a closed deal. It includes steps like prospecting, qualifying, pitching, handling objections, and closing.
- Sales Pipeline, on the other hand, refers to the stages a lead moves through during the buying cycle. It helps you visualize deal volume, conversion rates, and revenue potential at each stage.
- Sales Process Flowchart is the visual representation of the sales process. It maps out each step using diagrams to show timing, ownership, and decision points, making it great for onboarding, cross-functional alignment, and workflow optimization.
Understanding the distinction between these three components allows you to build a more effective and scalable sales system.